STATS: Scoring trends – Timing, set pieces, headers, open play…
With the 21st season of Premier League football almost upon us, I thought I’d take a look back at how each of the 20 member clubs fared last time around in a variety of scoring categories.
It should be noted that the figures for Reading, Southampton and West Ham United are taken from a 46-game Championship season, as opposed to a 38-match Premier League campaign for each of the other 17 clubs.
Goals Scored by Half
This shows how the goals scored by each team in the 2011-12 league campaign were divided between the first half and second half of matches, both numerically and in percentage terms:
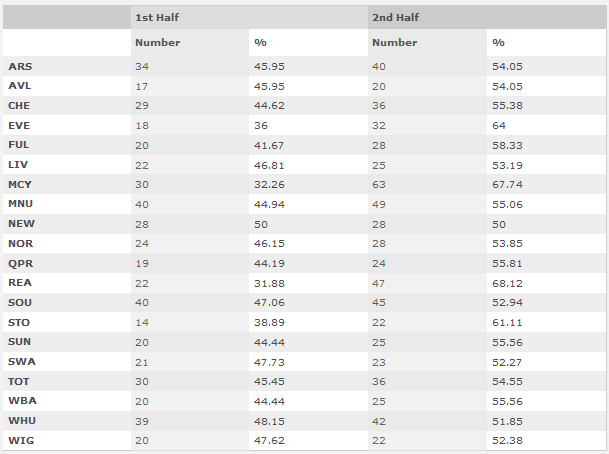
FIRST HALF – BEST
Manchester United & Southampton scored 40 goals apiece in the first half of league matches
Newcastle United netted 50% of their league goals in the first half of matches
FIRST HALF – WORST
Stoke City scored just 14 goals in the first half of league matches
Reading netted only 31.88% of their league goals in the first half of matches
SECOND HALF – BEST
Manchester City scored 63 goals in the second half of league matches
Reading netted 68.12% of their league goals in the second half of matches
SECOND HALF – WORST
Aston Villa scored just 20 goals in the second half of league matches
Newcastle United netted only 50% of their league goals in the second half of matches
Goals Scored from Shots/Headers
This shows how the goals scored by each team in the 2011-12 league campaign were divided between shots and headers, both numerically and in percentage terms:

SHOTS – BEST
Manchester City scored 80 goals from shots in league matches
Tottenham Hotspur netted 92.42% of their league goals from shots
SHOTS – WORST
Stoke City scored just 22 goals from shots in league matches
Stoke City netted only 61.11% of their league goals from shots
HEADERS – BEST
Reading, Southampton & West Ham United each scored 22 goals from headers in league matches
Stoke City netted 38.89% of their league goals from headers
HEADERS – WORST
Aston Villa scored just 3 goals from headers in league matches
Tottenham Hotspur netted only 7.58% of their league goals from headers
Goals Scored from Open Play/Set-Pieces
This shows how the goals scored by each team in the 2011-12 league campaign were divided between open play and set-pieces, both numerically and in percentage terms:
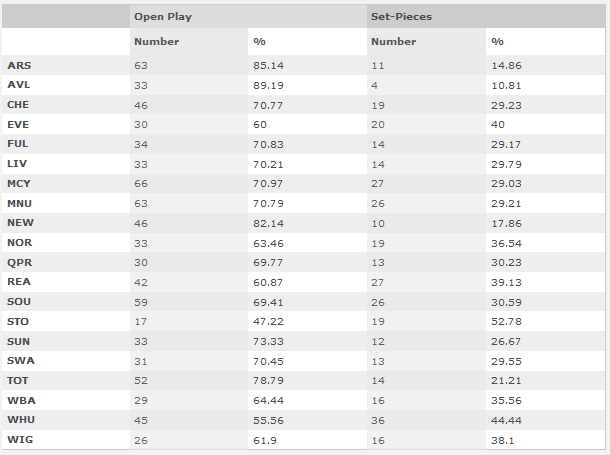
OPEN PLAY – BEST
Manchester City scored 66 goals from open play in league matches
Aston Villa netted 89.19% of their league goals from open play
OPEN PLAY – WORST
Stoke City scored just 17 goals from open play in league matches
Stoke City netted only 47.22% of their league goals from open play
SET-PIECES – BEST
West Ham United scored 36 goals from set-pieces in league matches
Stoke City netted 52.78% of their league goals from set-pieces
SET-PIECES – WORST
Aston Villa scored just 4 goals from set-pieces in league matches
Aston Villa netted only 10.81% of their league goals from set-pieces
Summary
It is interesting to note that Newcastle United were the only team to score as many goals in the first half of league matches as they did in the second. The inability of Aston Villa to score goals from headers or set-pieces came as something of a surprise, whilst the set-piece prowess of Stoke City and West Ham United is there for all to see.